
Northern California's vibrant cycling culture from the winding paths of Marin County to the bustling streets of San Francisco comes with a hidden danger: bicycle car collisions that send hundreds to hospitals each year, often due to driver negligence or poor infrastructure. This comprehensive guide is essential reading for you, whether you're a daily commuter pedaling across the Bay Bridge, a weekend warrior exploring Sacramento trails, or a concerned driver sharing these roads, because understanding these risks could mean the difference between a safe ride home and a life-altering injury.
Tailored for cyclists, motorists, and personal injury claimants throughout the personal injury law industry in Northern California from Oakland to Fresno this blog delivers actionable benefits like empowering you with cyclist rights on the road, helping you identify liability pitfalls before they happen, and guiding you through maximizing compensation after a crash.
By the end, you'll have a clear roadmap covering the primary causes of these collisions, the latest 2025-2026 crash statistics from reliable sources like the California Highway Patrol (CHP) and Office of Traffic Safety (OTS), critical state and federal laws such as California Vehicle Code (CVC) 21200, real-world lawsuits that set precedents, practical prevention tips from both cyclist and driver perspectives, and a detailed walkthrough of filing injury claims, all informed by my professional experience as a San Francisco personal injury attorney at Ladva Law serving the entire Northern California region.
Primary Causes of Bicycle Car Collisions: A Deeper Dive
When examining the root causes of bicycle car collisions in Northern California, one of the most prevalent issues is drivers failing to yield during left turns, which accounts for approximately 25% of all such incidents according to patterns documented by the National Highway Traffic Safety Administration (NHTSA) and echoed in state-specific data. This happens frequently on multi-lane roads like Interstate 280, where motorists misjudge a cyclist's speed and swing into their path, often because they simply aren't scanning low enough on the road for vulnerable road users.
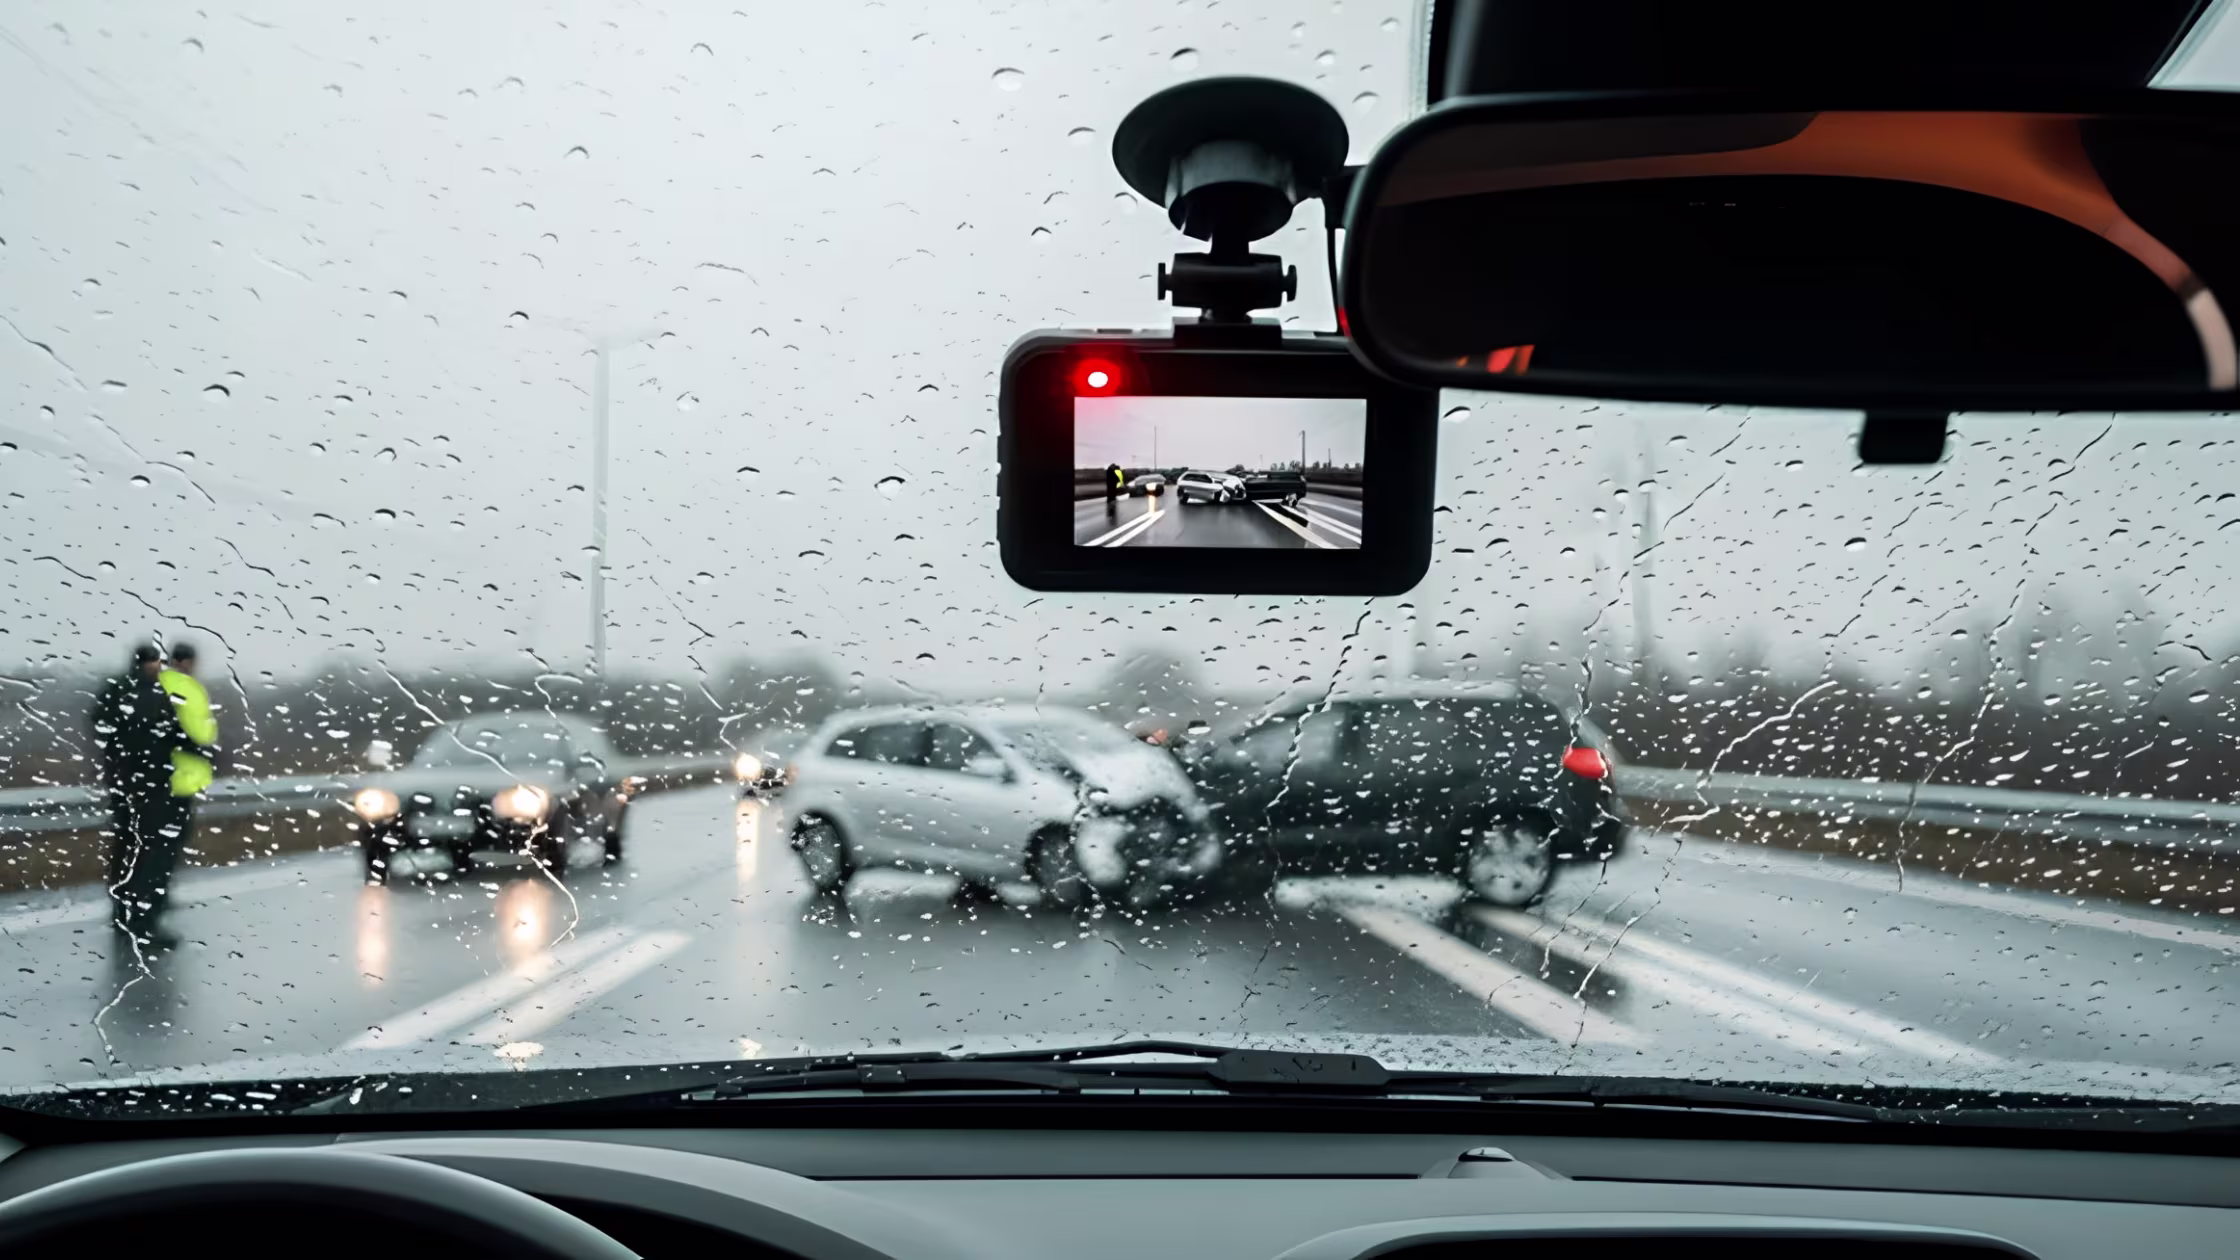
Distracted driving, fueled by smartphones and in-car infotainment systems, contributes to another 15-20% of these crashes, with studies showing that even a momentary glance away at a text message can lead to catastrophic failures in perception on busy arterials like Highway 101 north of San Francisco.
Additionally, road hazards such as potholes, gravel patches, or uneven pavement destabilize bicycles, prompting evasive maneuvers that propel riders into oncoming traffic this factor plays a role in about 10% of collisions, particularly during rainy seasons when wet leaves exacerbate slick conditions in areas like the East Bay hills.
These causes aren't abstract; they reflect real-world dynamics in Northern California's diverse terrain, from urban gridlock to suburban bike lanes. In 2024 alone, California recorded 9,752 bicycle-involved crashes resulting in injuries or fatalities, representing about 23% of the national total largely due to our high population density and cycling enthusiasm. The Bay Area stands out as a hotspot, with San Francisco reporting 12 fatalities per 100,000 residents between 2020 and 2024, while neighboring Solano County edges higher at 14 per 100,000.
Helmets, which can reduce head injury severity by up to 60%, are worn by only about 50% of riders in these scenarios, underscoring a compliance gap that amplifies outcomes. As a practicing attorney who's reviewed dozens of these cases at Ladva Law, I've seen how a single pothole on a marked bike route can turn a routine commute into a multi-vehicle pileup, highlighting the need for both personal vigilance and systemic improvements.
To visualize these patterns clearly, consider the following breakdown based on verified collision data:
2026 Crash Statistics: What the Numbers Reveal
Diving into the most recent data from the Statewide Integrated Traffic Records System (SWITRS), Northern California counties such as San Francisco and Alameda consistently average over 500 bicycle collisions annually in the years leading up to 2025, with national fatalities climbing 4.4% to 1,105 in 2023 alone.
The California Office of Traffic Safety's (OTS) 2023 report paints an even starker picture statewide, documenting 129 cyclist deaths, 75% of which occurred in urban environments like the dense corridors of the Bay Area. Over the 2020-2024 period, the region tragically logged around 6,500 pedestrian and cyclist fatalities combined, with Lake County topping per capita rates at 38 per 100,000 residents due to its rural roads lacking bike infrastructure.
Projections for 2026 suggest over 10,000 bicycle-related crashes across California, driven partly by the explosive growth in e-bike usage, which increases speeds and thus impact forces in collisions. Injury profiles are grim: fractures account for 40% of hospital admissions, head trauma 30%, and spinal injuries a devastating 15%, often requiring surgeries that cost victims tens of thousands in immediate care.
Demographically, males comprise 80% of victims, with crashes peaking from July through October during peak commuting and recreational seasons. From my vantage at Ladva Law, we've observed a noticeable uptick in claims during evening rush hours on routes like U.S. 101, where fading daylight compounds visibility issues. These statistics aren't just numbers they represent shattered helmets, crumpled frames, and families waiting in emergency rooms, emphasizing why proactive education is non-negotiable.
Understanding California Laws and Cyclist Rights
At the heart of protecting riders lies California Vehicle Code (CVC) 21200, which explicitly affirms cyclist rights by treating bicycles as equivalent to motor vehicles, allowing full lane usage whenever traffic conditions, narrow roads, or hazards necessitate it, there's no legal requirement to hug the right shoulder if it's unsafe. Complementing this, CVC 21801(a) mandates that drivers yield to oncoming cyclists during left turns, with violations carrying fines starting at $100 and escalating based on injury severity. For younger riders, CVC 21212 requires helmets for those under 18, enforceable with a $25 fine, while federal guidelines from NHTSA stress enhanced visibility measures like front white lights and rear red reflectors after sunset to mitigate low-light risks prevalent in foggy Northern California mornings.
Infrastructure plays a role too; OTS allocates grants for protected bike lanes, yet gaps persist on high-speed corridors, forcing cyclists into mixed traffic. Cycling under the influence falls under CVC 21200.5, treated similarly to DUI with $150 fines and potential license impacts. In practice, cyclist rights on the road extend to proper signaling for turns and stops, but the onus remains heavily on drivers to "share the road" vigilantly failure to do so often forms the basis of successful liability claims in my cases.
Landmark Bicycle Collisions Lawsuits and Precedents
High-profile lawsuits underscore accountability in bicycle collisions. A 2025 San Mateo County case held the county liable for a fatal crash on Alpine Road, where a cyclist was killed after a driver made an unsafe turn; the family successfully argued that inadequate signage and road design overcame governmental immunity, securing a substantial settlement. Similarly, a Newport Beach wrongful death suit targeted the city and adjacent property owners for failing to install proper warnings before a truck struck a rider, establishing that public entities can be held responsible when maintenance negligence contributes. These cases pave the way for average settlements exceeding $500,000, often bolstered by black-box data from vehicles and biomechanical experts reconstructing crash dynamics.
Actionable Prevention Tips for Safer Roads
Cyclists can bolster safety with always-on lights, reflective gear, and assertive lane positioning before intersections, while drivers must adhere to the 3-foot passing rule under CVC 21760 and make eye contact at junctions. Apps like Strava help map personal hazard zones. Professionally, I always advise GoPro footage it's transformed losing cases into six-figure wins at Ladva Law.
Navigating Most Common Personal Injury Cases in California
Among the most common personal injury cases in California, those stemming from car collisions involving vulnerable cyclists consistently rank at the top, with over 150,000 automobile-related claims filed annually statewide according to Office of Traffic Safety analogs, many originating in Northern California's urban cores where dooring incidents and hook turns lead to approximately 1,200 hospitalizations each year across the Bay Area alone. These crashes produce devastating medical bills often surpassing $50,000 per victim, encompassing everything from skin grafts for severe road rash to complex spinal fusions necessitated by impacts at even moderate speeds of 30 miles per hour.
Insurance companies frequently attempt to invoke doctrines of contributory negligence by pointing to a lack of lights or improper positioning, even when CVC protections clearly favor the cyclist, which can arbitrarily slash potential payouts by significant margins. Juries in these trials meticulously review dashcam footage and eyewitness accounts to apportion fault, particularly in door-swing scenarios where the driver's negligence is evident. The long-term repercussions extend far beyond the initial trauma, with physical therapy regimens stretching six to twelve months and lost wages hitting gig economy delivery riders the hardest due to their reliance on daily pedaling income. Settlements in these matters typically factor in both special damages like documented medical expenses and general damages for pain and suffering, landing in the mid-range of $200,000 for moderate fractures with lingering effects.
Importantly, California's two-year statute of limitations for personal injury claims begins ticking from the date of injury, making it critical not to delay gathering evidence such as fading bruises or mechanical inspections of the bicycle frame. Expert witnesses, including accident reconstruction specialists, play a pivotal role by quantifying the physics of the collision demonstrating how a cyclist can be propelled up to 50 feet in a typical urban crash. This interconnected landscape of personal injury litigation reveals how bicycle cases amplify vulnerabilities compared to standard car-on-car incidents, tying directly into broader trends like slips, falls, and animal attacks that dominate caseloads.
For a thorough breakdown by county including alarming 20% rises in Alameda along with filing strategies like securing police reports and witness affidavits, I highly recommend checking out our detailed blog on the most common personal injury cases in California: https://www.ladvalaw.com/blog/most-common-personal-injury-cases-in-california. Many of these cases resolve through pre-trial mediation, though punitive damages remain rare unless aggravating factors like driving under the influence are present, and strong attorney referrals can dramatically improve outcomes across the board.
Parallels with Motorcycle Accident Claims California
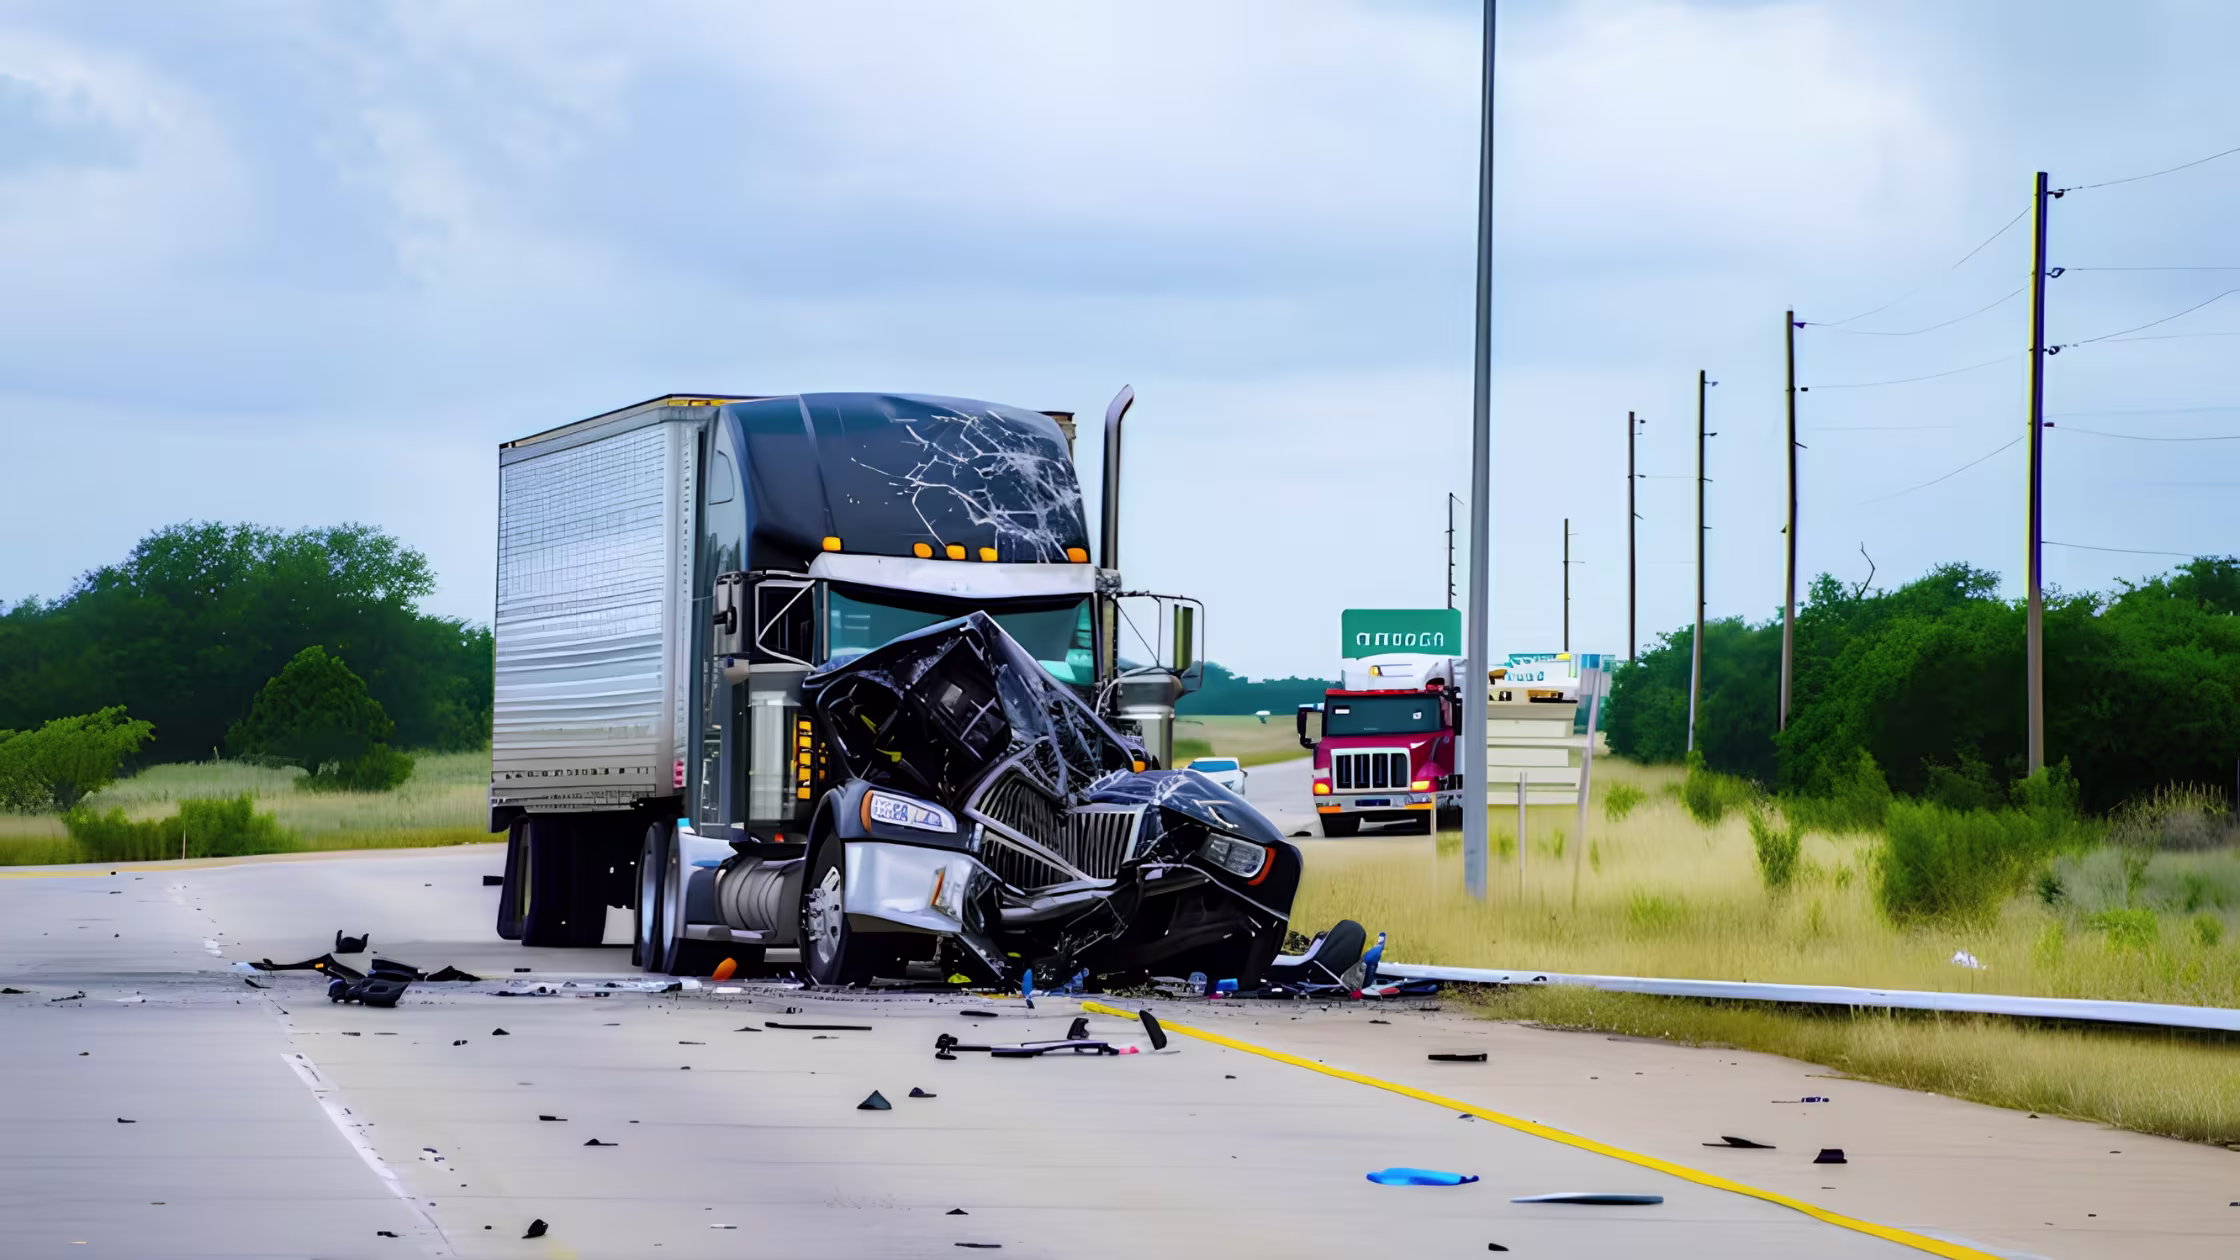
Drawing direct parallels, motorcycle accident claims California share striking similarities with bicycle collisions in terms of rider vulnerability, lane-sharing conflicts, and the perils of left-hook maneuvers that claim lives on Northern California's roads. The CHP documents over 600 motorcycle crashes annually, a figure that pales in comparison to the 9,000-plus bicycle incidents but underscores identical visibility challenges, where helmet laws under CVC 27803 mirror bicycle mandates and non-compliance can reduce insurance recoveries by up to 20%. Medical trajectories overlap significantly, with orthopedic surgeries for fractures and traumatic brain injuries mirroring those from bike ejections, often racking up $100,000 or more in costs that strain families.
Insurers deploy similar defenses, including invasive surveillance to question injury severity, tactics I've countered successfully in both arenas at Ladva Law. Landmark verdicts, such as a $1.2 million San Francisco award for lane-splitting negligence, provide blueprints for building strong bicycle claims against distracted drivers. To unpack critical elements like medical liens, gaps in uninsured motorist coverage, and the mandatory 30-day insurer response timelines that apply equally, explore our in-depth blog on motorcycle accident claims California: https://www.ladvalaw.com/blog/motorcycle-accident-claims-california. Expert valuations extend to intangible losses like permanent scarring, while community cycling and riding groups offer invaluable prevention insights that inform safer habits for all two-wheeled travelers.
Lessons from a Landmark Motorcycle Accident Insurance Case Study
A landmark motorcycle accident insurance case study offers profound insights into insurer tactics during vulnerable road user crashes, directly applicable to bicycle car collisions where bad-faith denial and delay tactics prolong victims' suffering long after the wheels stop turning. In this appellate victory, the court imposed penalties on the carrier for egregiously lowballing a clear-liability claim, awarding additional damages that now serve as a precedent for cyclists pursuing extras against at-fault drivers in similar straits. Standard auto policies often cap bodily injury at $30,000 per person, leaving uninsured/underinsured motorist provisions to bridge critical gaps, while dashcam exclusions have been repeatedly debunked in court.
For a full dissection of the legal briefs, key precedents, and strategies like arbitration that favor policyholders, read our analytical blog: https://www.ladvalaw.com/blog/a-landmark-motorcycle-accident-insurance-case-study. Medical liens are subordinated through mechanisms like Miller caps, structured annuities provide tax-free long-term payouts, and trials ruthlessly expose internal adjuster notes that reveal manipulative practices. This knowledge equips riders to navigate the post-crash labyrinth with confidence.
Hit-and-Run Laws and Their Impact on Cyclists
California hit-and-run laws pose a unique nightmare for cyclists, as CVC 20002 requires drivers to immediately stop, exchange information, and render aid after any collision; misdemeanor violations escalate to felonies with great bodily injury, carrying up to three years in prison and $10,000 fines. Northern California's urban hit-and-runs have spiked 15% in recent years per CHP reports, leaving riders to tap limited state uninsured motorist funds capped at $30,000 far short of real damages.
Surveillance footage and public appeals become lifelines for identification. For everything from reward programs and DMV reporting protocols to civil pursuit strategies beyond criminal penalties, dive into our dedicated blog: https://www.ladvalaw.com/blog/california-hit-and-run-laws. Fines deter future offenses at $1,000 minimum, while eyewitness networks in cycling communities amplify recovery odds. Prevention through enhanced lighting helps capture license plates in fleeting moments.
The Emotional and Psychological Impact of Personal Injuries in Cycling Crashes
The emotional and psychological impact of personal injuries from bicycle collisions reverberates deeply, with studies indicating PTSD rates as high as 35% among survivors who relive the "phantom whoosh" of near-misses or actual impacts. Young cyclists, in particular, develop phobias toward roadways, manifesting as school avoidance or regression in milestones, while parents grapple with guilt and hypervigilance. Cognitive behavioral therapy courses run $5,000 or more, and familial bonds strain under the weight of ongoing caregiving demands. Our blog explores this human side: https://www.ladvalaw.com/blog/emotional-and-psychological-impact-of-personal-injuries. It details neurobiomarkers of chronic stress, SF support groups, and how claims-funded wellness restores lives. Resilience narratives from real recoveries inspire, with healing timelines varying from months to years.
Your Guide to Choosing the Best Lawyer for Auto Accident Cases
Selecting from a guide to choosing the best lawyer for auto accident cases demands scrutiny of Northern California expertise tailored to bicycle claims, prioritizing attorneys with proven verdict histories, ample resources for experts, and deep networks among CHP investigators. At Ladva Law, our track record exceeds $10 million in recoveries for vulnerable road users. Read our full guide: https://www.ladvalaw.com/blog/guide-to-choosing-the-best-lawyer-for-auto-accident-cases. Key questions cover contingency fees (no win, no fee), communication cadences like weekly updates, and local knowledge that outpaces national firms. Contingency models align incentives perfectly with client success.
Explore Ladva Law's Automobile Accidents Expertise
For specialized strategies in handling bicycle-related claims, visit our comprehensive automobile accidents service page: https://www.ladvalaw.com/expertise/automobile-accidents.
Imagine the wind in your hair turning to screams of metal on pavement one split-second lapse stole a father's last sunset ride. At Ladva Law, San Francisco's steadfast ally for Northern California injured cyclists since 2000, we transform pain into justice so you can pedal toward healing. Secure your free consultation today.
Frequently Asked Questions (FAQs)
Q. What are the leading causes of bicycle car collisions in Northern California?
Driver left-turn failures (25%) and distracted operation top the list.
Q. What do 2026 bicycle collisions statistics show for the Bay Area?
Over 500 per major county annually, with fatalities rising 4% nationally.
Q. What exactly are cyclist rights on the road under California law?
Full lane access per CVC 21200 when needed for safety.
Q. How do you file injury claims after car collisions with bicycles?
Prove negligence for liability; average settlements hit $500K with strong evidence.
Q. What fines apply to bicycle violations in Northern CA?
Helmets under 18: $25; cycling DUI: $150 minimum.
Q. Which San Francisco areas see the most bicycle car collisions?
High fatality rates of 12 per 100K residents.